Impacts on my workload when I became an Associate Professor
I became an Associate Professor of the Practice in January 2024. This means academic year (AY) 24–25 was the first time I had to negotiate the service requests and demands of an associate professor. Now that the academic year is over and I spent the last semester digesting the repercussions of those negotiations, I thought I’d write a blog post about it. My hope is that this blog post can serve as a case study on how workload changes when you become an associate.
First, my experience may not be yours, but I think sharing it would be useful to others. It gives you, my reader, a visceral sense of what could happen. Moreover, this blog post is a way for me to better process what happened. It also provides future me with a snapshot of what that first year was like and helps me better imagine the trade-offs and repercussions of my decisions.
So this blog post is unlikely to be for everyone, dear reader. But for some of you, let me provide a bit more of a vivid visual. Going from assistant to associate felt like the bubble wrap came off, and I didn’t even know it was there. And no one really helped me understand or taught me how to handle my environment without the bubble wrap. Perhaps in other jobs, it’s a slow increase in the requests to do more things, like feature creep in software. But in academia, the assistant title clearly signals that this person is still learning how to be a professor and gaining enough “fill in the blank” to prove they should get the associate title. But once you become an associate, that mindset disappears, which means everyone assumes you can handle and make decisions at the associate level, regardless of how many years you’ve had the title. And again, whether you’ve been taught how to handle depends on you and the mentors around you.
What Changed in my Responsibilities
As an Assistant Professor of the Practice, my service responsibilities were as follows:
- Advise students
- Assessment Liaison
- Member of the Undergraduate Affairs Committee
In academic year Fall 2024/Spring 2025, the year after I became an Associate Professor of the Practice, they changed to:
- Advise students — this was the only thing that stayed the same
- Assessment Liaison (for Fall 2024)
- Associate Director of Undergraduate Studies
- Chair of the Undergraduate Affairs Committee
- Course Coordinator of the Teaching Faculty
- Member of the Century Course Committee (starting Spring 2025)
- Member of the Promotion Committee for an Assistant Professor of the Practice
For context, item 6, Century Course Committee member, replaced item 2, Assessment Liaison, because when I was asked to be on the committee, I went to my chair and negotiated letting go of the assessment liaison role in exchange for serving on the committee.
What Happened to My Work Time?
For context, I track how much time I spend on things in 15-minute increments (full details on my How I Track My Time blog post). I pulled my data from the last two academic years. Fall 23 (Fa23) and Spring 2024 (Sp24) were before I had service at the associate level. Fall 2024 (Fa24) and Spring 2025 (Sp25) were after my service load shifted. I summed the total time working per week. Here is a box plot showing the distribution of the grand total per week for these four semesters:
 |
| Total number of hours worked per week per semester. |
Perhaps the first glaring thing to notice is that the median is noticeably above 40 hours a week. My approach to academia makes it very hard to actually have a 40-hour workweek. However, if I’m honest, this is unsurprising because there are aspects of being an academic that, in many ways, are more career-related than job-related, such as my podcast and this blog, but these still count as work hours. And while I will continue to strive to work fewer hours so I can spend more time on other things, I doubt I’ll ever work only 40 hours a week because things like this blog I kind of consider a hobby I enjoy doing just for the joy of it. But I digress, let’s refocus.
I clearly worked less before my service shifted, as the minimum and 25th percentile are lower for the pre-service shift than for the post-service shift. The Fa23 bottom dot represents the 18 hours I worked Thanksgiving week. The top dot for Sp25 is 60.25 hours, but that was the week I attended a conference, so again, not surprising, since I counted anything to do with the conference as work. Conferences may be just extended hours, like 8:30 to 6, but dinner with fellow researchers is, in many ways, still “work,” just a different kind.
Interestingly, in my post-service shift, the boxplots show my weekly work hours range contract, so it is clearly almost always more than 40 hours, while the max is shifted down. I think what happened is that I was always working at a high pace and trying to avoid big spikes because I had no reserves to handle them. Put another way, I got better at planning how long things would take me and “flattened the work hour curve” by front-loading and starting earlier. Regardless, the total hours clearly shifted up.
But how did I spend those hours? Let’s break it down by category. For the sake of this blog post, I collapsed my categories down to four: teaching, service, scholarly work, and other. Teaching and service, I hope, are self-explanatory. Scholarly work involves research, outreach, and keeping up with my field, such as reading literature and attending conferences. “Other” usually includes things like email, discussions with co-workers, walking between meetings/class, and a mix of the other categories, so it isn’t really categorizable except as “Other.”
These four categories kind of naturally pair together, so I paired them and locked the y-axis max for easier comparison. Here is Service and Other:
 |
| Hours spent on service work per week per semester. |
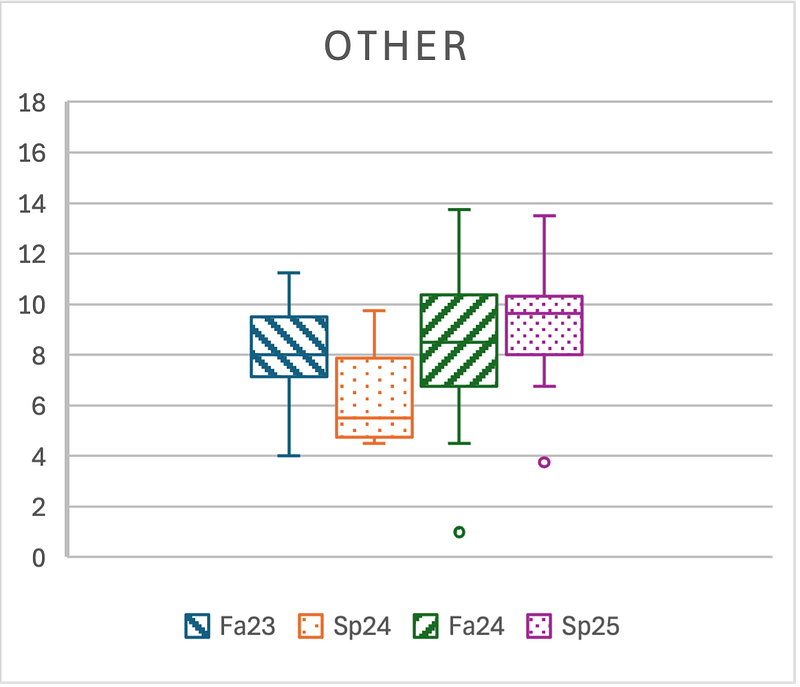 |
| Hours spent on other work per week per semester. |
The change in service hours is not very surprising. The academic year before I became an associate is clearly lower than the one after. The medians differ by at least 3 hours a week! As for why Sp24’s data is so wide, it was mainly due to running a bunch of online events while serving my last year as the SIGCSE TS Hybrid chair and reviewing for ICER. Sp25 has such a large range due to my service as Associate DUS slowly ramping up, followed by two new committees. Both spring semesters also involve attending graduation, which takes up a few hours of my day, even though I currently do not help organize.
The Other category I found more interesting because it went up generally, I suspect due to the increase in email I had to manage and more discussion with colleagues across categories, which makes it hard not to just put it under “Other.”
Teaching and scholarly work are where I spend most of my time, so here are those two categories, with the y-axis locked.
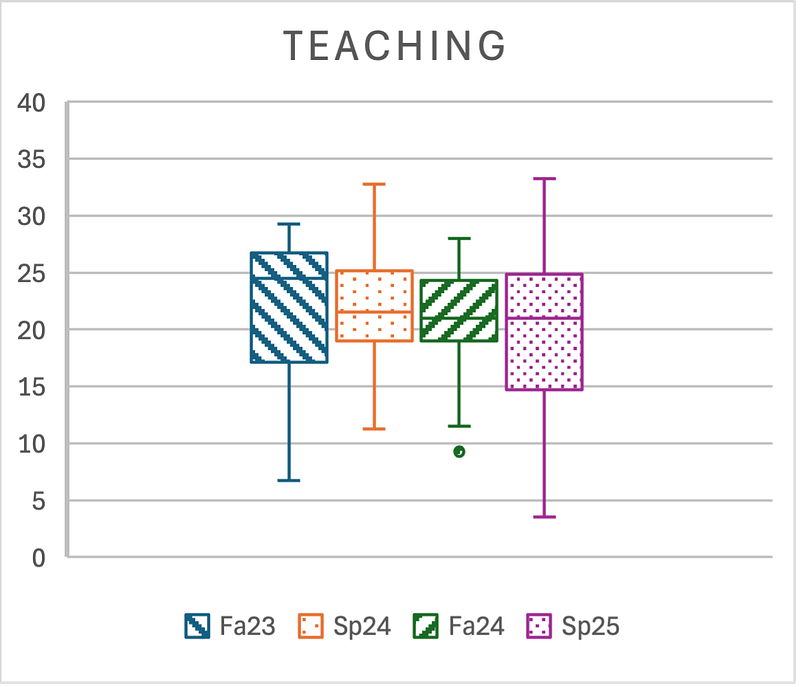 |
| Hours spent on teaching work per week per semester. |
 |
| Hours spent on scholarly work per week per semester. |
The median teaching hours dropped in Sp24, right when I became an associate, and did not change thereafter. But what is interesting is how the teaching context changed. I taught the same large class for all four semesters, but in Sp25 I also created a new, small, graduate-level class in my field. Checking my notes, in Fa23 I did a major exam overhaul for my large class, and then the changes afterward were pretty minimal. The general message here is that once my service began to increase, I consistently looked for ways to be more efficient and to delegate more tasks to my teaching team.
Scholarly work took the most significant hit due to the increased service load, with the median dropping from 13 hours in Fa23 to 8 hours in Sp25. This is not surprising, since it has the least direct accountability to ensure I make progress, while teaching and service tasks always have urgency or someone waiting for me to do something for them. Basically, a lot of the extra service hours I needed got taken from my scholarly work. On top of that, the new class in Sp25 made things worse in some ways. However, it thankfully was not as bad as it could have been because the course was in my research area. So, all the students I would usually have done research with as independent studies instead took the course, and that time got counted as teaching time. This just past semester, Fall 2025, I also created a new course, so I suspect I will see different numbers if I include that data as well, but this blog post is getting long enough!
How/Why did this happen?
If I’m honest, I am, as always, partially to blame for my problems. NCFDD discusses how to say no at mid-career, and its newsletter on the topic highlights three factors that keep mid-career faculty from saying no more often. They are technical errors, psychological blocks, and external constraints. For me, I’ve mostly handled the technical errors. It’s the psychological blocks that really get me, especially these three:
- You feel overly responsible for things that aren’t entirely your responsibility.
- You believe everything will fall apart unless you do the work.
- You’re overcompensating and/or trying to prove you belong.
The extent to which each psychological block is present in a given situation varies, but these three are often present when I say “yes” to things that I didn’t necessarily need to. Beyond that, I rarely remind my mentors and chair about my current service load and whether the current service request makes sense within that context, primarily through the lens of workload, what I need to do for the next promotion, and being a good citizen of the department/school.
But then again, let’s not forget the systemic issues at play. Service requests rarely consider a person’s context nor include a framework to help the person make the decision of whether to say yes. The academic system is not designed for such situations, likely for many reasons, including the fact that the person making a service request may be too busy to consider the context of the person from whom they are requesting service, or may simply assume that this person already has the necessary decision-making framework. Let’s also not forget the known and grave gender disparities in department/school service, where women often do more service work than men, and the kind of service they do is often less high-profile, even though it must be done just as much as the high-profile service work.
Summary
In summary, service work increased, and to compensate, I found efficiencies in my teaching and sacrificed some of my scholarly work. I also worked more, but there’s nuance there. Instead, how much I worked became more consistent and “settled” in a range of mainly above 40 hours. I also clearly have a ceiling on how many hours I’m willing to/can put in, though the fact that that ceiling is basically 55 hours doesn’t really lend itself to work-life balance.
The reason why this happened is partially self-inflicted and partially systemic. After this blog post, I plan to write another post outlining a framework for approaching these decisions. It’ll probably be another post to help me process how I want to make these kinds of decisions moving forward, and as I go through my second year at the associate level. If you have questions or thoughts, feel free to leave me a comment or send me an email!

Comments
Post a Comment